Chart Reading 101: How To Read Nautical Charts

There’s more than one boat owner out there who doesn’t have access to any nautical charts. Maybe you’re one of them. No paper nautical charts and no electronic nautical charts available either. For many boaters, it’s like owning a road map. It’s outdated and, if you know where you’re going, why bother? But there’s a lot more to a nautical chart than showing you just a map of water. Even if you’re on the Great Lakes by the cabin, using a chart is always a good idea.
A nautical chart conveys what you can see and what you can’t. They show you where you are as well as what else should be there. Nautical charts specifically depict water areas of importance. Things like land contours, water depths and more are included. If you need to know where to find red buoys and green buoys, the nautical chart has your back. Let’s take a look at how and why you should read nautical charts. The National Oceanic and Atmospheric Administration makes many nautical charts. But there are also international charts in other countries. Make sure you choose the right ones.
How to Read a Nautical Chart Scale
You can choose between a small scale chart and a large scale chart. Obviously there are times when either will be appropriate. The scale is represented as a fraction. If the scale is 1:30,000 it means that 1 inch on your chart equals 30,000 inches in real life. That means 1 inch is about 0.4 nautical miles. So one nautical mile will be around 2.5 inches. Make sure you check the units on your chart, however. A chart from Canada will not use inches and the scale will be different.
- Small scale charts offer greater detail but cover a smaller area. Harbor charts may have a scale around 1:20,000.
- Large scale charts offer less detail but cover a larger area. A large scale chart could be just a general chart or a coastal chart. The scale may be 1:80,000 or even over 1:1,000,000.
Harbor charts are typically the most detailed. A harbor chart covers areas close to shore. Check the scale on your chart to determine just how much area is being covered. Measuring distance is easier on small craft charts. When the entire chart covers a massive area, one nautical mile can be imperceptible.
Why it matters: If you’re planning a trip, it’s always good to know the actual distance. Especially if there are things you want to see and/or avoid.
What Are Contour Lines?
If you’re looking at a nautical chart, you’ll see lines that create irregular, blobby shapes in the water. These sometimes will shade from lighter blue to darker blue. These are depth contour lines. Contour lines depict the underwater landscape. The lines are usually represented in fathoms. A fathom equals six feet. So a place on a chart that depicts a contour line will show a change in depth by one fathom, or six feet. Always check the scale on your chart to be sure, though. Not every chart is measured in feet and fathoms.
If you are using a larger scale chart, contour lines will only be included for greater changes in depths. There may be as much as three fathoms difference between contour lines in deep water.
Why it matters: Depending on the draft of your boat, contour lines can be a big deal. You want to avoid water that is too shallow. Also, if you’re fishing, this can make an important difference.
What are Depths?
This one is pretty self explanatory. Water depths are depicted on a chart as a number in the water. The number indicates the water depth at that point. The scale will tell you if it’s feet or meters or something else. You may also have depths, called soundings, in fathoms and feet. These are on older charts and should probably be updated. Since 1992, US charts have done soundings in meters.
Soundings for depth are done at mean lower low water. That’s when low tide is at its lowest. The number is average depth over 19 years. That means the number on a chart is probably not going to be accurate when you hit the water that day. Depending on time, the actual depth could be much deeper or not. Low tides and high tides can change dramatically, after all.
Why it matters: Like contour lines, depth affects where you can safely travel. You don’t want to hit water too shallow for your keel. The closest underwater clearance is something you need to know as tides change. Avoiding shallow water and other dangers is important.
Understanding Chart Symbols
Nautical charts make use of many chart symbols. In fact, they can’t all fit on a chart key at all. Instead, you can pick up a copy of U.S Chart No.1: Symbols, Abbreviations and Terms. You can download one at the link there for free. These different symbols often mark dangers in the water. Visual objects and ones that can’t be seen because of water depth. The cover many area details you would not think of. Things like dredged channels. That’s what makes these important in the real world.
Chart symbols cover everything from rocks in the water to power lines to bridges. Anything and everything you’ll encounter on the water can and should be included in general charts.
Common Chart Symbols
Check the chart notes somewhere below the chart title. It should clue you in to what all your chart shows. That includes longitude and latitude scale and others things that helps boaters determine their best course. Look for these common symbols as well.
Rocks
There are several symbols used to show rocks. It often depends on the kind of chart you have. Also the kind of rock you’re dealing with. If the rock symbol has a plus sign, it’s a submerged rock and will always be below water. If there’s an asterisk, it will uncover at low tide.
Islets

The number indicates how high above the water the islet projects.
Breakers

A breaker is a danger to small boats. It’s what happens when a swell hits a shallow sea bed that’s about double the size of the swell or less. The swell “breaks” and you get breakers. These can wreak havoc on small vessels.
Coral Reefs

Just what the name suggests. Great places to scuba dive but potentially dangerous for sailing.
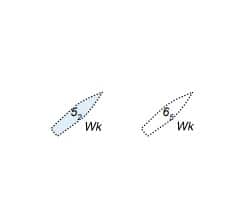
Wrecks

Sunken ships! Cool but potentially hazardous. If the wreck has a dotted outline it never uncovers and is always below. Check depth to see if it’s safe. A solid line will be uncovered so steer clear. If the wreck looks like a fish spine in a circle, it means the mast is visible. You should avoid this.
Spoil Area

This is a place to avoid. There are random obstructions in the water that can cause damage. Depth can change frequently.
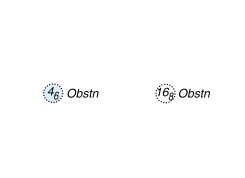
Obstructions

If it’s not a reef or a rock, it can still cause damage. Poles, tree stumps, even an old car in the water could qualify here. These can damage your vessel and must be avoided. Any unusual items that endanger your boat are obstructions.
What’s a Compass Rose?

A compass rose on a nautical chart looks like a standard compass. The biggest difference with a compass rose is that there is a circle set inside a circle. Each compass circle shows a different but important aspect of navigation. The outer circle shows true cardinal directions. The inner circles show magnetic north. True north points you to the north pole. Magnetic north aligns you with the Earth’s magnetic field. True north can never move but magnetic can. Your vessel likely uses a magnetic compass.
View the full article here.
